Fig. 4
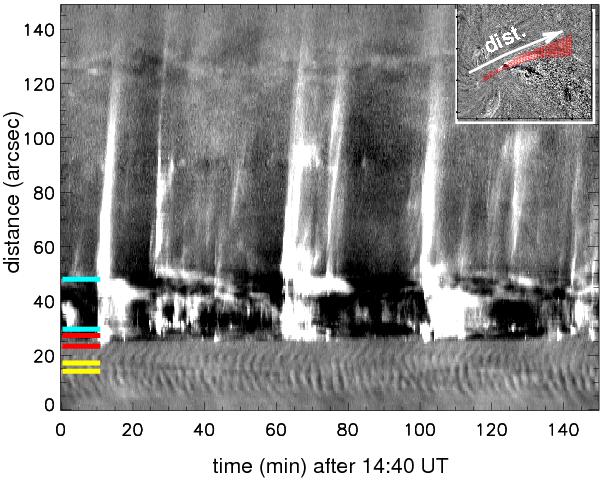
Time series of 211 Å intensity variations along the red hashed region shown in the inset. At each distance the intensity across the region (perpendicular to the arrow) has been averaged. On the left the yellow and red lines indicate the sunspot and footpoint regions used for cross-correlation. The light blue lines indicate the loop region.
Current usage metrics show cumulative count of Article Views (full-text article views including HTML views, PDF and ePub downloads, according to the available data) and Abstracts Views on Vision4Press platform.
Data correspond to usage on the plateform after 2015. The current usage metrics is available 48-96 hours after online publication and is updated daily on week days.
Initial download of the metrics may take a while.