Fig. 1
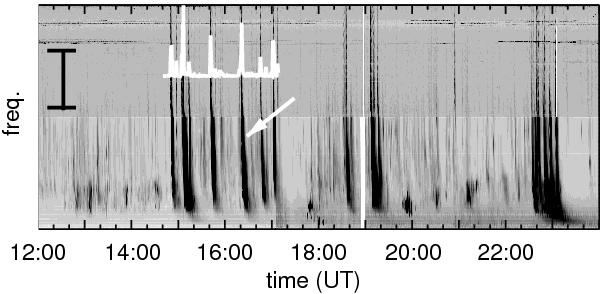
WIND/WAVES dynamic spectrum from 12:00–24:00 UT on 3 Aug. 2010. The frequency ranges from 20 kHz to 13.6 MHz. The black bar on the left indicates the frequency range used to obtain the over-plotted white line which is the signal used for cross-correlation. The white arrow points to the radio signal from the 16:20 UT jet shown in Fig. 2.
Current usage metrics show cumulative count of Article Views (full-text article views including HTML views, PDF and ePub downloads, according to the available data) and Abstracts Views on Vision4Press platform.
Data correspond to usage on the plateform after 2015. The current usage metrics is available 48-96 hours after online publication and is updated daily on week days.
Initial download of the metrics may take a while.