Fig. 2
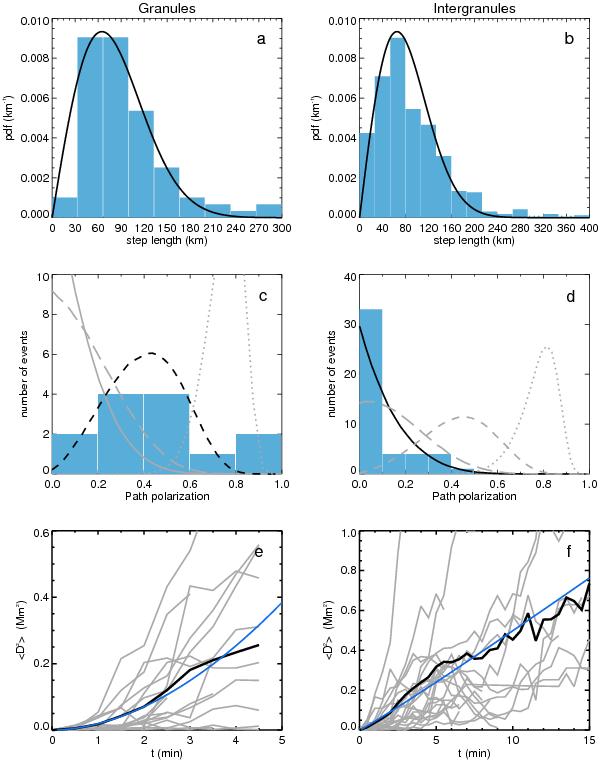
Statistical properties of the walks followed by footpoints while in granules (left panels), and in intergranular lanes (right panels). a), b) distribution (probability density function, pdf) of the observed step lengths (histogram), and fit to a Rayleigh distribution  with σ = 65 km (solid line). c) distribution of path polarization (see text) for paths with at least 6 steps (3 min) on a granule. Solid line shows expected distribution calculated from 6-step random paths assuming the step distribution of panel a); long-dashed, dashed, and dotted lines, the expected distribution when drifts of 2.4, 4.6 , and 9.7 km s-1, respectively, is added. A reasonable fit is achieved for the black line. d) as in panel c) but for intergranular paths with at least 12 steps (average of 24 steps). Best fit (black line) for pure random walk without drift. e), f) end-to-end distance squared D2 = [X(t) − X(t0)] 2 + [Y(t) − Y(t0)] 2 (t0 = 0, for granules in panel e), or the moment when the intergranular path begins in panel f), covered by magnetic elements, and mean square distance ⟨ D2 ⟩ averaged over realizations (thick black line). Blue (dark grey) lines show that best fits to ⟨ D2 ⟩ ~ ta are obtained with a = 1.7 and a = 0.96 (diffusive regime), for granules and intergranules, respectively.
Current usage metrics show cumulative count of Article Views (full-text article views including HTML views, PDF and ePub downloads, according to the available data) and Abstracts Views on Vision4Press platform.
Data correspond to usage on the plateform after 2015. The current usage metrics is available 48-96 hours after online publication and is updated daily on week days.
Initial download of the metrics may take a while.