Fig. 9
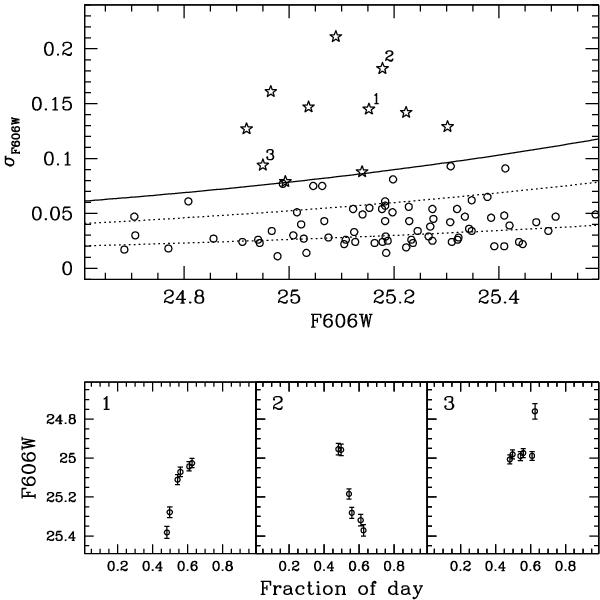
Process of detection and selection of candidate RR Lyrae is illustrated using B336 as an example. Upper panel: the standard deviation of the five individual measures of F606W is plotted as a function of the average F606W. The candidates RR Lyrae were selected among stars with 24.9 ≤ F606W ≤ 25.4, as stars with rms deviations larger then 3σ (open stars). The continuous line indicates the 3σ level and the dotted lines the 2 and 1σ levels. Lower panels: light curves of the candidates RR Lyrae detected in the upper panel and labeled with 1, 2, and 3, taken as examples. Candidates 1 and 2 show coherent patterns of variations at all sampled epochs, compatible with genuine RR Lyrae variables. Candidate 3 is a classical case of spurious detection: F606W is constant at all epochs except one, likely corresponding to the hit of a cosmic ray over the PSF area of the star in the individual image at that epoch.
Current usage metrics show cumulative count of Article Views (full-text article views including HTML views, PDF and ePub downloads, according to the available data) and Abstracts Views on Vision4Press platform.
Data correspond to usage on the plateform after 2015. The current usage metrics is available 48-96 hours after online publication and is updated daily on week days.
Initial download of the metrics may take a while.