Fig. 7
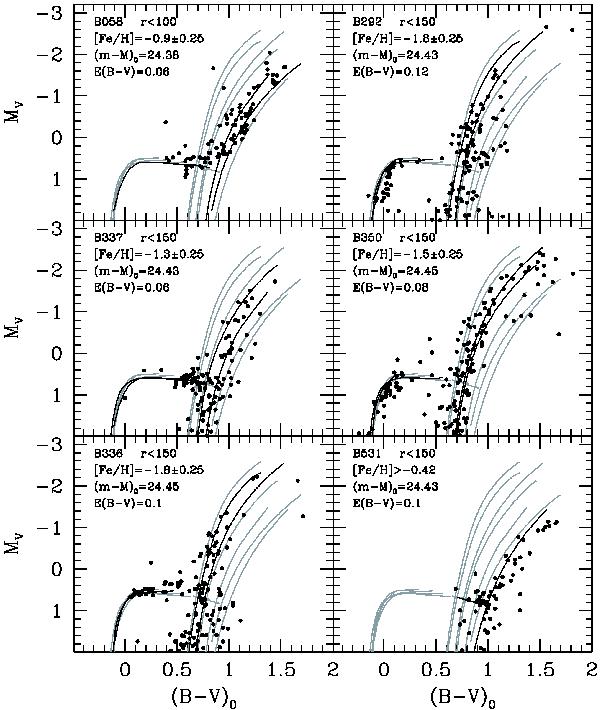
CMDs of the clusters after statistical decontamination from field stars with a superposed grid of HB and RGB templates. The ridge lines that provide the best fit to the observed HB and bracket most of the RGB population are plotted as heavier lines to highlight them. The adopted values for the metallicity, reddening, and distance modulus are reported in the upper left panel of each plot.
Current usage metrics show cumulative count of Article Views (full-text article views including HTML views, PDF and ePub downloads, according to the available data) and Abstracts Views on Vision4Press platform.
Data correspond to usage on the plateform after 2015. The current usage metrics is available 48-96 hours after online publication and is updated daily on week days.
Initial download of the metrics may take a while.