Fig. 9
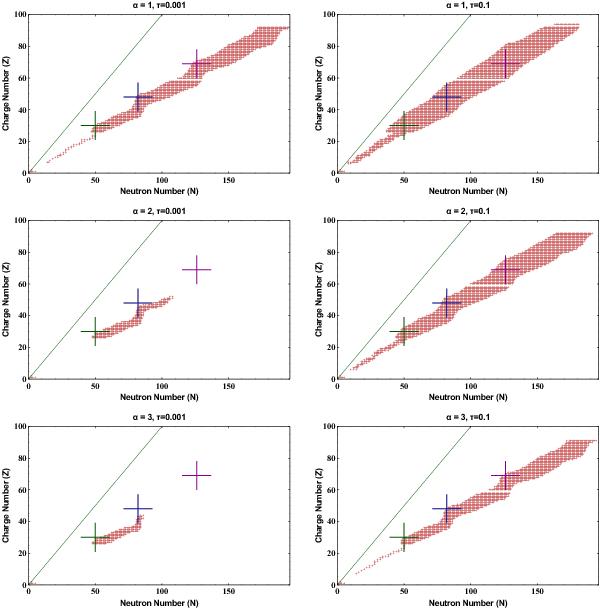
The final Z versus N distribution is plotted for each dynamic simulation (after one second duration). In each panel the solid green line is at N = Z, and the large crosses mark the location of the closed neutron shells. For each panel the same initial temperature (4 × 10⁹ K), density (1 × 10¹¹ g/cc) and electron fraction (0.03) are used. The left column of panels use an expansion timescale of τ = 0.1 s and for the right column of panels, the expansion timescale is τ = 0.001 s. Each row considers a different density profile: top ρ(t) ∝ (t/τ)-1, middle ρ(t) ∝ (t/τ)-2, bottom ρ(t) ∝ (t/τ)-3.
Current usage metrics show cumulative count of Article Views (full-text article views including HTML views, PDF and ePub downloads, according to the available data) and Abstracts Views on Vision4Press platform.
Data correspond to usage on the plateform after 2015. The current usage metrics is available 48-96 hours after online publication and is updated daily on week days.
Initial download of the metrics may take a while.