Fig. 5
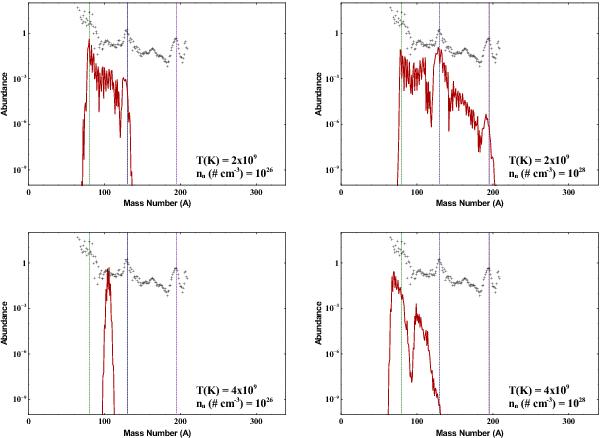
Final abundances in the static simulations after one second of neutron bombardment and at different physical conditions. Top left: nn = 1026 cm-3 and T9 = 2, top right: nn = 1028 cm-3 and T9 = 2, bottom left: nn = 1026 cm-3 and T9 = 4, bottom right: nn = 1028 cm-3 and T9 = 4. The solar abundance is shown in each case with vertical lines marking the location of the important peaks.
Current usage metrics show cumulative count of Article Views (full-text article views including HTML views, PDF and ePub downloads, according to the available data) and Abstracts Views on Vision4Press platform.
Data correspond to usage on the plateform after 2015. The current usage metrics is available 48-96 hours after online publication and is updated daily on week days.
Initial download of the metrics may take a while.