Fig. 8
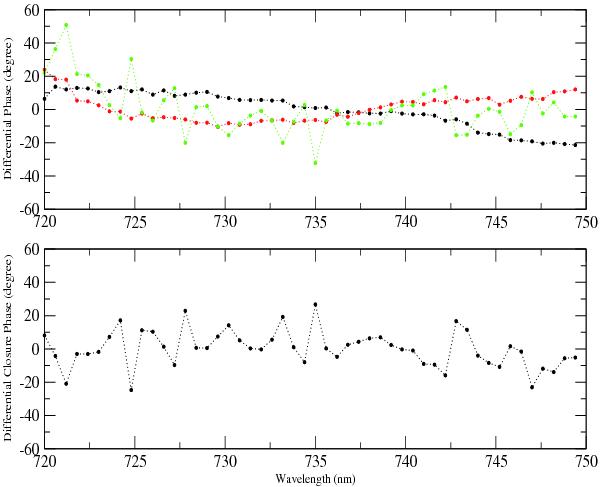
Top: plots represent the differential phases in a narrow spectral band of 0.6 nm with respect to the wavelength (baseline E1E2 in black, E2W2 in red, E1W2 in green). Bottom: plot represents the differential closure phase deduced from the three individual differential phases. Each estimate corresponds to 400 s of observation of calibrator star HD 55185 using VEGA with three telescopes (E1E2W2) at medium spectral resolution and fringe tracking done with CLIMB. Individual error bars are not plotted for clarity. On baselines E1E2 and E2W2, the errors are at the level of 0.5°, whereas on the baseline E1W2 they are closer to 5°.
Current usage metrics show cumulative count of Article Views (full-text article views including HTML views, PDF and ePub downloads, according to the available data) and Abstracts Views on Vision4Press platform.
Data correspond to usage on the plateform after 2015. The current usage metrics is available 48-96 hours after online publication and is updated daily on week days.
Initial download of the metrics may take a while.