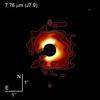
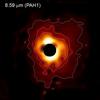
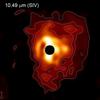
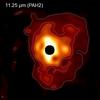
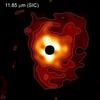
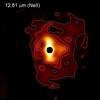
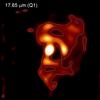
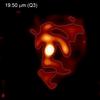
Fig. 6
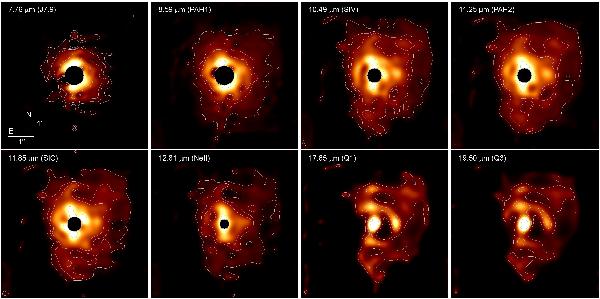
PSF subtracted and deconvolved images of the CSE of Betelgeuse for the eight VISIR filters in the N and Q bands. The field of view is 5.63″ × 5.63″ for all images, with North up and East to the left. The color scale is a function of the square root of the intensity and is normalized to the maximum and minimum intensity in the image. The contour levels correspond to 0.01, 0.05, 0.1, 0.5 and 1.0 W m-2 μm-1 sr-1. For the N band images, the dark spot close to the center corresponds to the saturated part of the image that was ignored in the deconvolution process.
Current usage metrics show cumulative count of Article Views (full-text article views including HTML views, PDF and ePub downloads, according to the available data) and Abstracts Views on Vision4Press platform.
Data correspond to usage on the plateform after 2015. The current usage metrics is available 48-96 hours after online publication and is updated daily on week days.
Initial download of the metrics may take a while.