Fig. 5
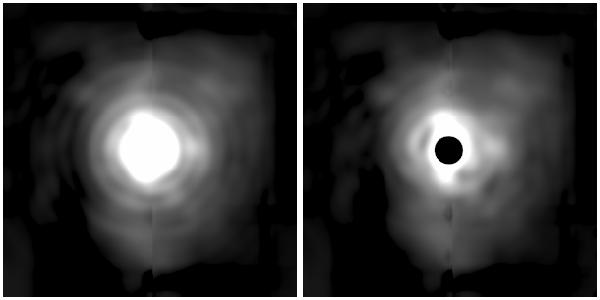
Image of Betelgeuse in the PAH2 filter before (left) and after (right) the subtraction of the PSF image derived from the observation of Aldebaran. The grey scale is a function of the square root of the intensity between 0 and 0.5 W m-2 μm-1 sr-1. The black disk in the center corresponds to the non-linear and saturated part of the Betelgeuse image that was masked after the subtraction.
Current usage metrics show cumulative count of Article Views (full-text article views including HTML views, PDF and ePub downloads, according to the available data) and Abstracts Views on Vision4Press platform.
Data correspond to usage on the plateform after 2015. The current usage metrics is available 48-96 hours after online publication and is updated daily on week days.
Initial download of the metrics may take a while.