Fig. 2
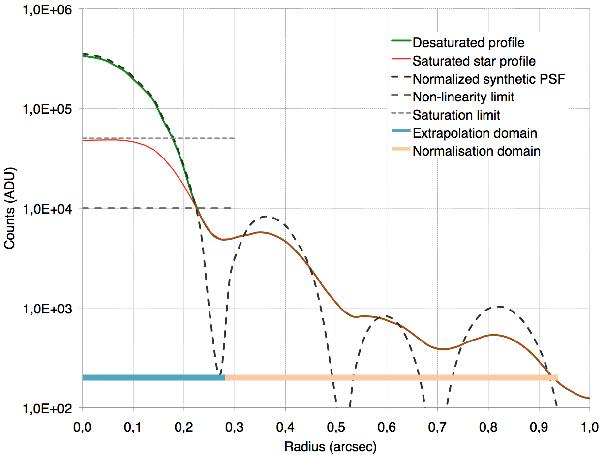
Principle of the restoration of the saturated PSF core of the images of Aldebaran. The curves represent radial median profiles of the original saturated image (thin red curve), the desaturated image (thick green curve) and the synthetic PSF used for the central extrapolation (dashed grey curve). The non-linearity and saturation limits are represented with dashed and dotted grey lines.
Current usage metrics show cumulative count of Article Views (full-text article views including HTML views, PDF and ePub downloads, according to the available data) and Abstracts Views on Vision4Press platform.
Data correspond to usage on the plateform after 2015. The current usage metrics is available 48-96 hours after online publication and is updated daily on week days.
Initial download of the metrics may take a while.