Fig. 10
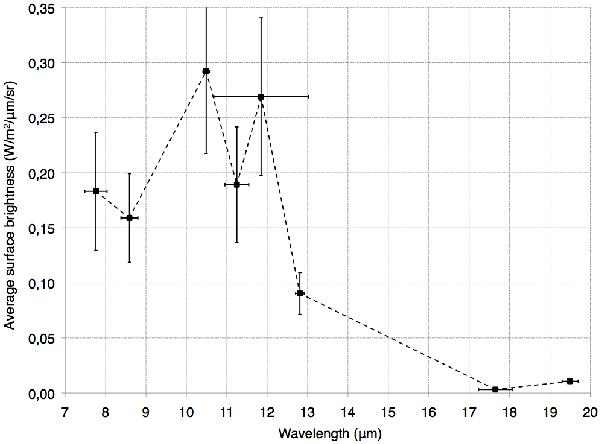
Average surface brightness over a rectangular area located on the Eastern section of the shell (defined in Fig. 7). The vertical error bars correspond to the standard deviation of the surface brightness over the measurement area, and the horizontal error bars indicate the spectral width at half transmission of the VISIR filters.
Current usage metrics show cumulative count of Article Views (full-text article views including HTML views, PDF and ePub downloads, according to the available data) and Abstracts Views on Vision4Press platform.
Data correspond to usage on the plateform after 2015. The current usage metrics is available 48-96 hours after online publication and is updated daily on week days.
Initial download of the metrics may take a while.