Free Access
Fig. 2
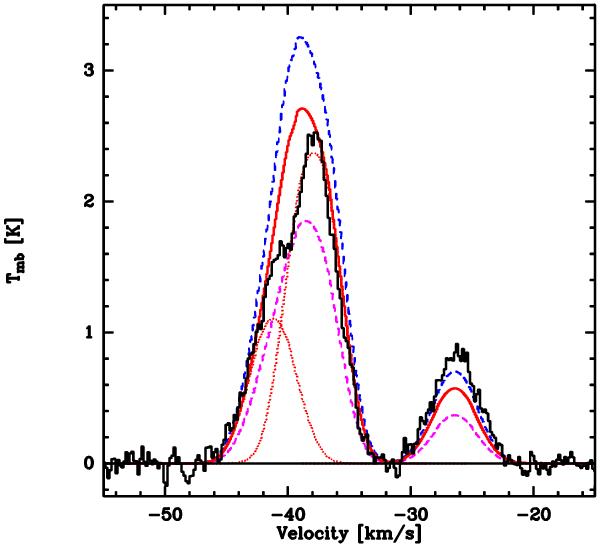
Resulting HIFI spectrum after subtraction of the best fit outflow component. Overplotted are the spherical envelope models for constant OH abundances of 1 × 10⁻⁸ (blue dashed), 8 × 10⁻⁹ (red solid with individual components red dotted) and 5 × 10⁻⁹ (pink dashed). Hyperfine components were simply added (see text).
Current usage metrics show cumulative count of Article Views (full-text article views including HTML views, PDF and ePub downloads, according to the available data) and Abstracts Views on Vision4Press platform.
Data correspond to usage on the plateform after 2015. The current usage metrics is available 48-96 hours after online publication and is updated daily on week days.
Initial download of the metrics may take a while.