Fig. 1
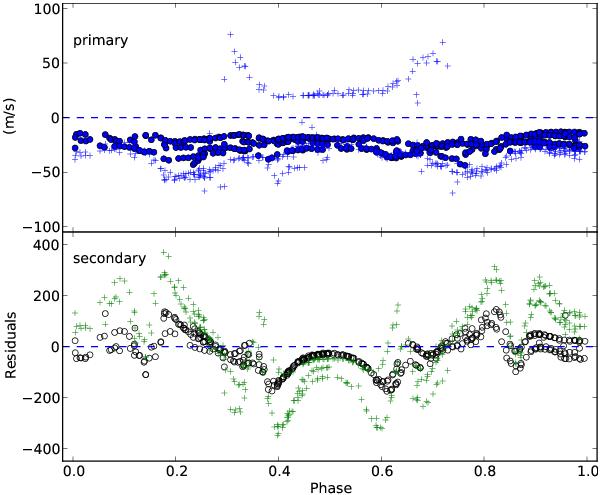
Residual velocities from simulated spectra. Circles denote the final setup using 62 échelle orders. Pluses indicate the residuals when using only 19 orders. A simulated spectrum was computed for the time of every observed spectrum, and the same method as used for the observations was applied to derive the radial velocities of the two components. The offsets shown here are the differences between the velocities used to construct the simulated spectra and the values measured. Systematic offsets mostly affect the secondary star, with absolute values peaking at about 50% of the single measurement error of typically 300 m s-1 for component B. Increasing the number of orders and thus the wavelength range clearly suppresses the systematic errors.
Current usage metrics show cumulative count of Article Views (full-text article views including HTML views, PDF and ePub downloads, according to the available data) and Abstracts Views on Vision4Press platform.
Data correspond to usage on the plateform after 2015. The current usage metrics is available 48-96 hours after online publication and is updated daily on week days.
Initial download of the metrics may take a while.