Fig. 1
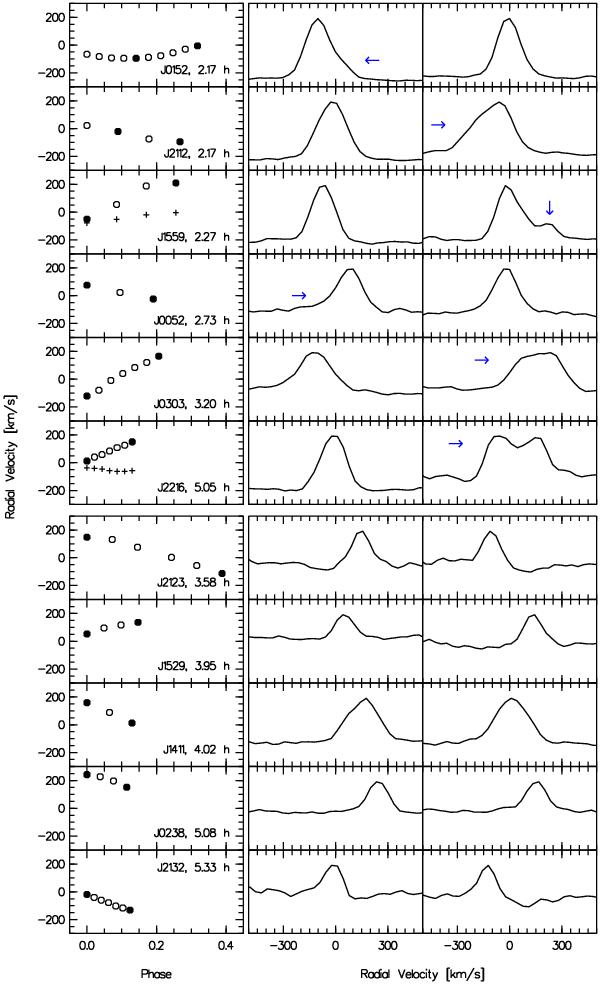
Hα line profiles of the targets, normalised to the intensity maximum. For each object, two examples profiles are shown that correspond to the radial velocities marked as filled circles in the left subpanel. Since the ephemerides are not known with sufficient precision for an extrapolation, the zero point of the orbital phase was arbitrarily set to the first data point of the respective sets. The upper main panel presents the six systems with multiple emission sources, with arrows marking the signature of the weaker component. The lower panel shows the remaining five systems. The radial velocities were measured by fitting a single Gaussian to the line profile, with the exception of J1559 and J2216, where a combination of two Gaussians was used.
Current usage metrics show cumulative count of Article Views (full-text article views including HTML views, PDF and ePub downloads, according to the available data) and Abstracts Views on Vision4Press platform.
Data correspond to usage on the plateform after 2015. The current usage metrics is available 48-96 hours after online publication and is updated daily on week days.
Initial download of the metrics may take a while.