Fig. 1
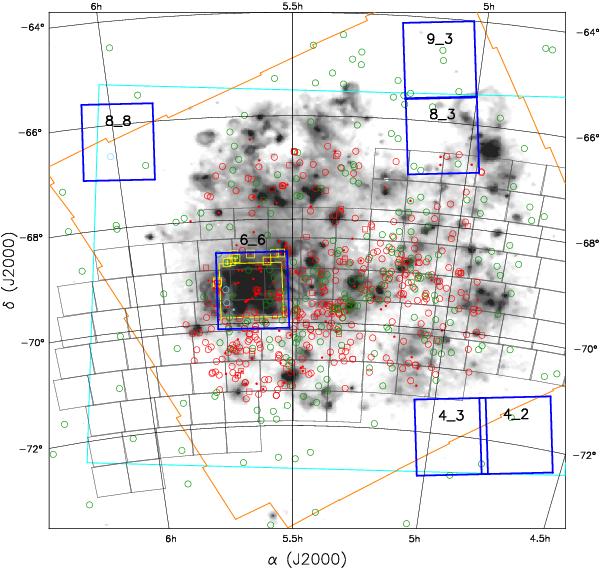
SHASSA Hα mosaic of the LMC (Gaustad et al. 2001) in a lambert azimuthal equal-area projection overlaid with catalogued LMC PNe (Leisy et al. 1997, green symbols; RP2006b, red symbols; Miszalski et al. 2011b, light blue symbols). Different symbols correspond to true (circles), likely (squares) and possible (dots) PNe. VMC tiles observed in the first year of operations are shown in blue (see Cioni et al. 2011). Complementary survey footprints are also shown including UBVi photometry from Zaritsky et al. (2004) in cyan, Spitzer MIR photometry from Meixner et al. (2006) in orange (at 8.0 μm) and I-band time-series photometry from Udalski et al. (2008a,b) in grey. Objects with ESO WFI optical observations considered in this work are bounded by yellow boxes (see Sect. 3.1).
Current usage metrics show cumulative count of Article Views (full-text article views including HTML views, PDF and ePub downloads, according to the available data) and Abstracts Views on Vision4Press platform.
Data correspond to usage on the plateform after 2015. The current usage metrics is available 48-96 hours after online publication and is updated daily on week days.
Initial download of the metrics may take a while.