Fig. 1
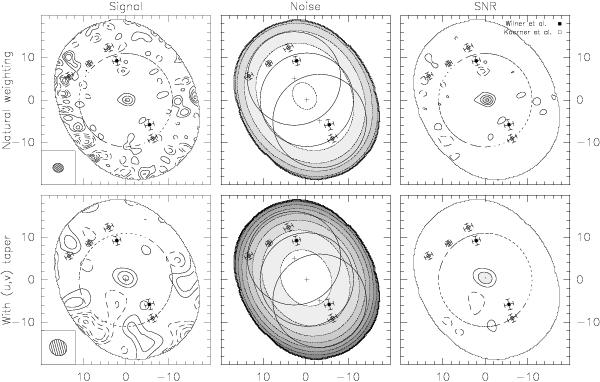
Top left: natural weighting 1.3 mm continuum image (corrected for the primary beam attenuation). The angular resoluion is 2.5 × 2.1′′ at PA 82° and the contour spacing 0.5 mJy/beam (2.1 mK), with negative contours being dashed. The dashed circle represents the primary-beam half-power field of view. Top center: corresponding noise map. Contour spacing is 0.2 mJy/beam. The circles show the observed individual fields (half-power field of view, centered on the crosses). Top right: signal-to-noise ratio map. Contour spacing is 2σ. Bottom left: 1.3 mm continuum image obtained with a (u,v) taper. Angular resolution is 4.2 × 3.7′′ at PA 60° and contour spacing is 0.6 mJy/beam (0.8 mK). Bottom center: corresponding noise map. Contour spacing is 0.2 mJy/beam (with the first contour being at 0.4 mJy/beam). Bottom right: signal-to-noise ratio map. Contour spacing is 2σ. In all maps, the filled square symbols indicate the location of the extended emissions found by Wilner et al. (2002) and the empty square symbols indicate the location of the peaks reported by Koerner et al. (2001). North is up, and east to the left.
Current usage metrics show cumulative count of Article Views (full-text article views including HTML views, PDF and ePub downloads, according to the available data) and Abstracts Views on Vision4Press platform.
Data correspond to usage on the plateform after 2015. The current usage metrics is available 48-96 hours after online publication and is updated daily on week days.
Initial download of the metrics may take a while.