Free Access
Fig. 3
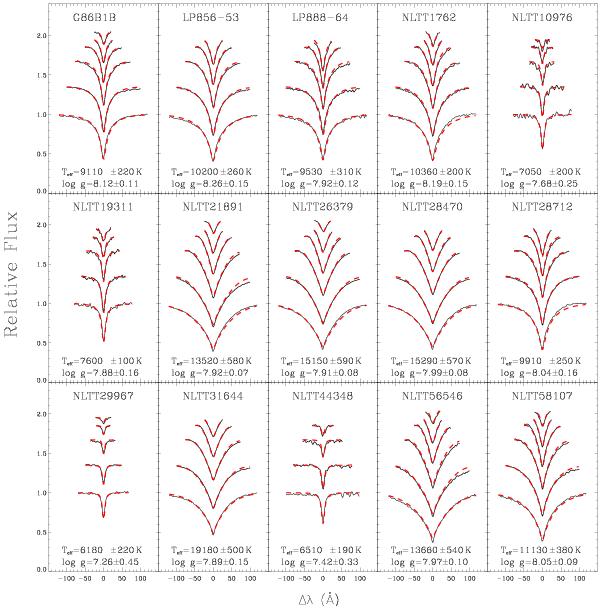
Fits to the individual Balmer lines for the WDs observed at the WHT of ORM. The line profiles correspond to Hβ (bottom) up to Hϵ, H8, or H9 (top) depending on the object. We have applied vertical shifts for clarity. The solid lines are the observed spectra and the dashed lines the model that best fits the profile.
Current usage metrics show cumulative count of Article Views (full-text article views including HTML views, PDF and ePub downloads, according to the available data) and Abstracts Views on Vision4Press platform.
Data correspond to usage on the plateform after 2015. The current usage metrics is available 48-96 hours after online publication and is updated daily on week days.
Initial download of the metrics may take a while.