Fig. 2
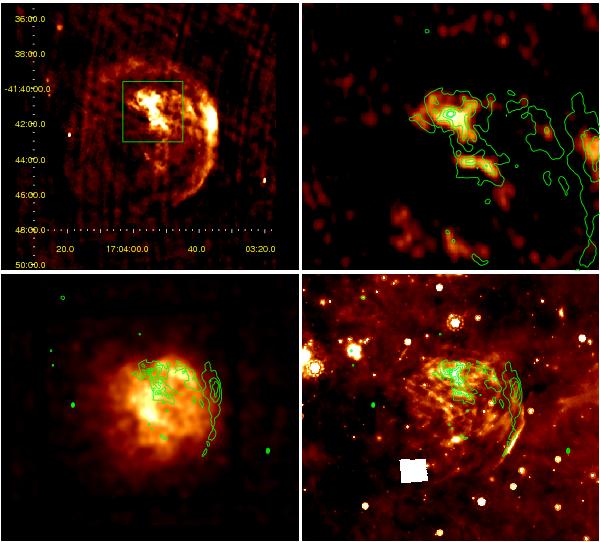
Upper-left: ATCA and VLA radio image of G344.7−0.1 at 1.4 GHz. The green square shows the area enlarged in the contiguous panel; upper-right: the central nebula as observed with ATCA at 5 GHz; lower-left: XMM-Newton EPIC image of G344.7−0.1 in the 0.3−8.0 keV energy band; lower-right: mid-infrared 24 μm image of G344.7−0.1 from Spitzer MIPSGAL; the blank square has data flagged as problematic.
Current usage metrics show cumulative count of Article Views (full-text article views including HTML views, PDF and ePub downloads, according to the available data) and Abstracts Views on Vision4Press platform.
Data correspond to usage on the plateform after 2015. The current usage metrics is available 48-96 hours after online publication and is updated daily on week days.
Initial download of the metrics may take a while.