Fig. 9
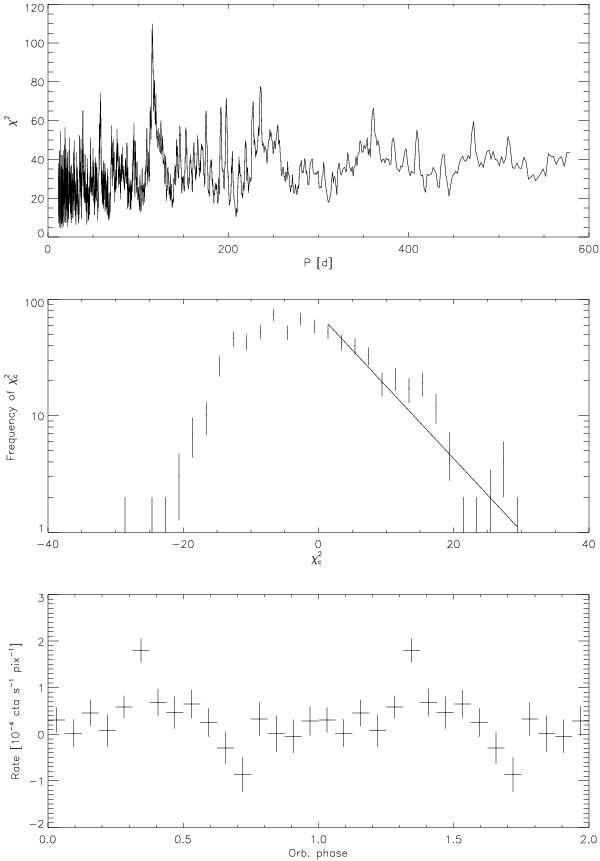
Results of the search for periodicity in the Swift/BAT data obtained with the technique described by D’Aì et al. (2011). The upper panel shows the χ2 computed from the Swift/BAT lightcurve folded at different periods in the range 15–600 days. The most prominent peak is at 116.2 ± 0.6 days. To estimate the significance of this peak, we followed the procedure described in D’Aì et al. (2011), and report the histogram of the detrended χ2 values in the middle panel. We show in the bottom panel the Swift/BAT lightcurve (15–50 keV) of the source folded at the best determined orbital period (116.2 ± 0.6 days). The reference time used is 54 877.3957 MJD. Each phase bin in the plot corresponds to an integration time of three days.
Current usage metrics show cumulative count of Article Views (full-text article views including HTML views, PDF and ePub downloads, according to the available data) and Abstracts Views on Vision4Press platform.
Data correspond to usage on the plateform after 2015. The current usage metrics is available 48-96 hours after online publication and is updated daily on week days.
Initial download of the metrics may take a while.