Fig. 8
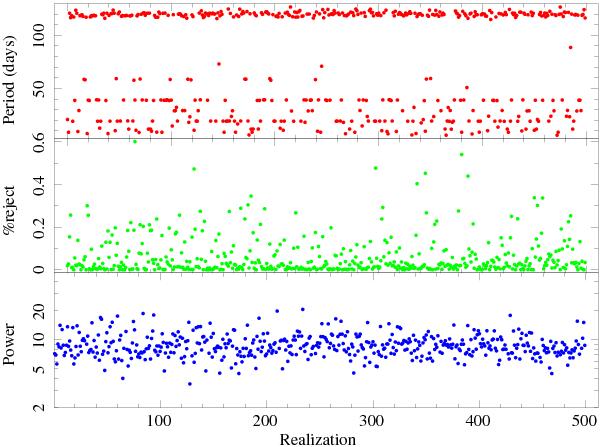
Results of the simulations carried out to investigate the significance of the period at ~120 days found from the Swift/BAT data. The upper panel shows the value of the period for each simulation (the number of the simulation is reported on the x-axis). The middle panel reports the probability that the detection of a period is false in each simulation (i.e., a value of 0.1 corresponds to a detection significance of 90% c.l.), and the lower panel the power of each peak in the corresponding LS diagram.
Current usage metrics show cumulative count of Article Views (full-text article views including HTML views, PDF and ePub downloads, according to the available data) and Abstracts Views on Vision4Press platform.
Data correspond to usage on the plateform after 2015. The current usage metrics is available 48-96 hours after online publication and is updated daily on week days.
Initial download of the metrics may take a while.