Free Access
Fig. 4
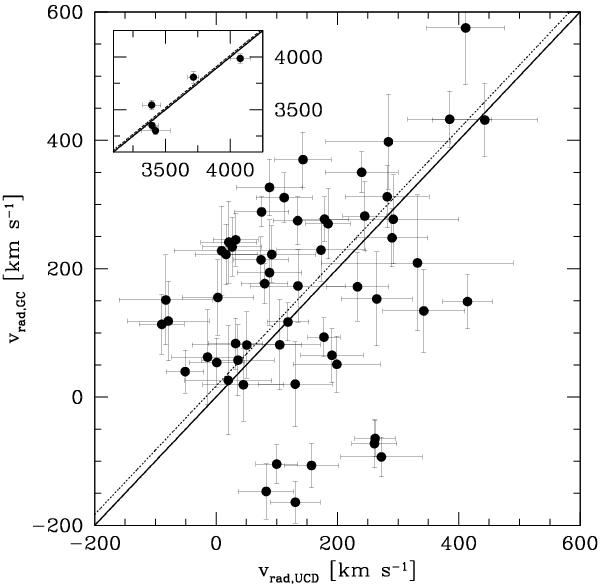
Comparison of the radial velocities measured in the UCD survey to the radial velocities measured in the GC survey. The dotted line is the fitted relation with slope one. The solid line is the one-to-one relation. The inset in the upper left corner shows the comparison for cluster GCs/UCDs.
Current usage metrics show cumulative count of Article Views (full-text article views including HTML views, PDF and ePub downloads, according to the available data) and Abstracts Views on Vision4Press platform.
Data correspond to usage on the plateform after 2015. The current usage metrics is available 48-96 hours after online publication and is updated daily on week days.
Initial download of the metrics may take a while.