Fig. 15
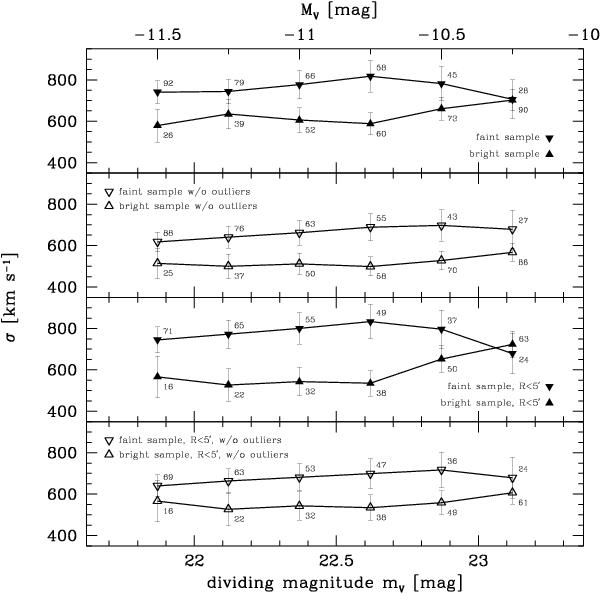
Velocity dispersion σ of a bright and a faint sample as a function of the dividing magnitude mV. The two upper panels show objects in the full radial range, the lower two only show objects with R < 5′ (cf. Fig. 13). The number of objects contained in the bright/faint sample is indicated next to each data point. The comparison is done for both the full sample (filled symbols) and the outlier-cleaned sample (open symbols).
Current usage metrics show cumulative count of Article Views (full-text article views including HTML views, PDF and ePub downloads, according to the available data) and Abstracts Views on Vision4Press platform.
Data correspond to usage on the plateform after 2015. The current usage metrics is available 48-96 hours after online publication and is updated daily on week days.
Initial download of the metrics may take a while.