Fig. 14
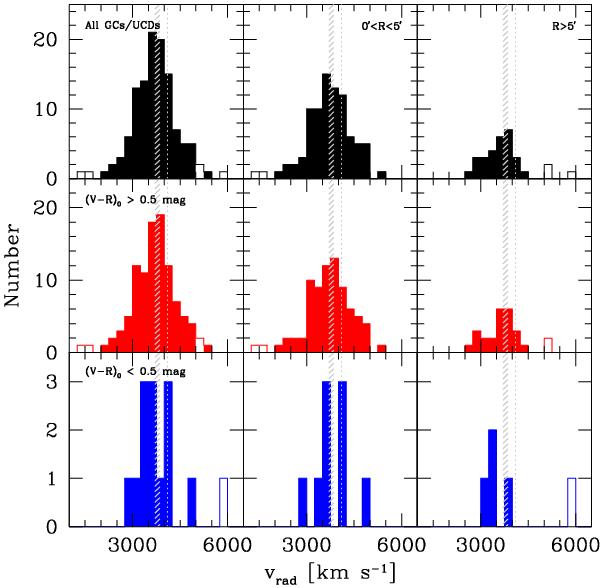
Radial velocity distribution of all identified GCs/UCDs (top left panel), the red subpopulation (middle left panel), and the blue subpopulation (bottom left panel). Each population is radially binned in the panels of the middle column (0′ < R < 5′) and the right column (R > 5′). In all panels, the open histogram represents the rejected objects, according to Fig. 13. The grey dashed area marks the range of radial velocities reported for NGC 3311 in the literature. The dotted vertical line indicates the systemic velocity of NGC 3309 at ~4100 km s-1.
Current usage metrics show cumulative count of Article Views (full-text article views including HTML views, PDF and ePub downloads, according to the available data) and Abstracts Views on Vision4Press platform.
Data correspond to usage on the plateform after 2015. The current usage metrics is available 48-96 hours after online publication and is updated daily on week days.
Initial download of the metrics may take a while.