Fig. 13
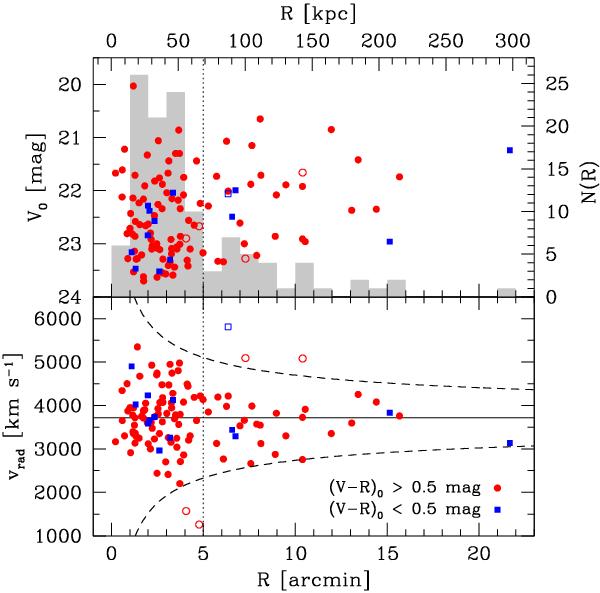
Apparent magnitude V0 and radial velocity vrad of confirmed cluster GCs/UCDs as a function of R, the projected distance from NGC 3311. The histogram in the upper panel shows the number counts in radial bins of 1′ width. The dashed curves in the lower panel envelope the objects that remain after applying the rejection algorithm (see text for details). They have the form  , where Cmax is the product v2·R for the first object that is not rejected, and vsys is the mean radial velocity of all objects (solid line). Open symbols denote the rejected objects. The vertical dotted line divides the inner from the outer sample.
Current usage metrics show cumulative count of Article Views (full-text article views including HTML views, PDF and ePub downloads, according to the available data) and Abstracts Views on Vision4Press platform.
Data correspond to usage on the plateform after 2015. The current usage metrics is available 48-96 hours after online publication and is updated daily on week days.
Initial download of the metrics may take a while.