Fig. 7
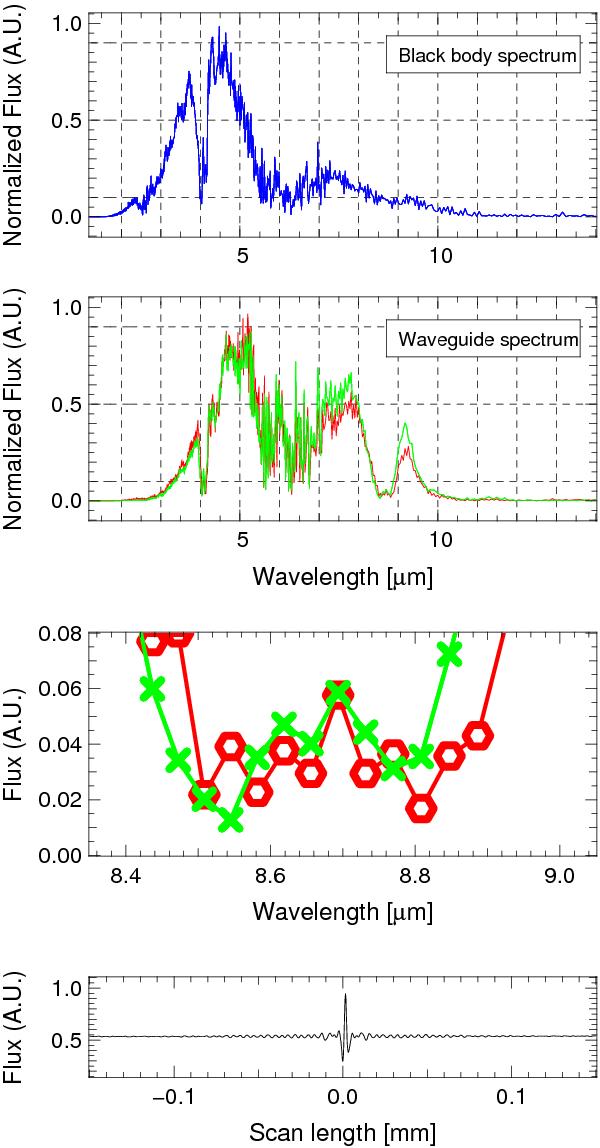
Top: raw spectrum of the black-body source in the 2–14 μm range. Transmission spectra of the raw black body. Central-top: two measurements (red and green curves) of the black-body source spectrum after coupling into a chalcogenide channel waveguide with opto-geometrical parameters similar to the Y-junction ones. Central-bottom: zoom on the single-mode cutoff wavelength region. Bottom: zoom on the typical white light interferogram obtained with the FTS.
Current usage metrics show cumulative count of Article Views (full-text article views including HTML views, PDF and ePub downloads, according to the available data) and Abstracts Views on Vision4Press platform.
Data correspond to usage on the plateform after 2015. The current usage metrics is available 48-96 hours after online publication and is updated daily on week days.
Initial download of the metrics may take a while.