Fig. 6
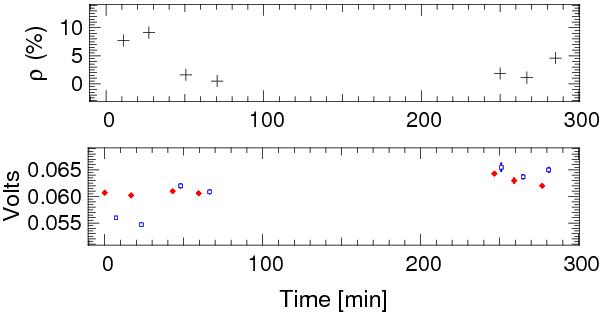
Top: evolution as a function of time of the photometric imbalance between the two arms of the Y-junction. Bottom: evolution as a function of time of the mean and error in the photometry-1 (blue open squares) and photometry-2 (filled red diamonds) signals. In most cases, the error bar is equal to or smaller than the symbol itself.
Current usage metrics show cumulative count of Article Views (full-text article views including HTML views, PDF and ePub downloads, according to the available data) and Abstracts Views on Vision4Press platform.
Data correspond to usage on the plateform after 2015. The current usage metrics is available 48-96 hours after online publication and is updated daily on week days.
Initial download of the metrics may take a while.