Free Access
Fig. 5
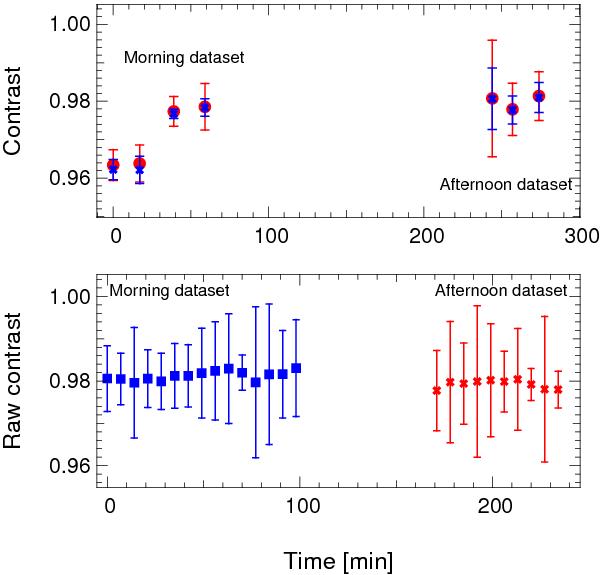
Top: raw (blue crosses, V) and calibrated (red filled circles, Vcor) visibilities measured from the dataset of October 14, 2010. Bottom: evolution as a function of time of the raw contrast obtained with the Y-junction on the dataset of October 6, 2010. The visibility points dispersion around the mean value is ± 0.001.
Current usage metrics show cumulative count of Article Views (full-text article views including HTML views, PDF and ePub downloads, according to the available data) and Abstracts Views on Vision4Press platform.
Data correspond to usage on the plateform after 2015. The current usage metrics is available 48-96 hours after online publication and is updated daily on week days.
Initial download of the metrics may take a while.