Fig. 4
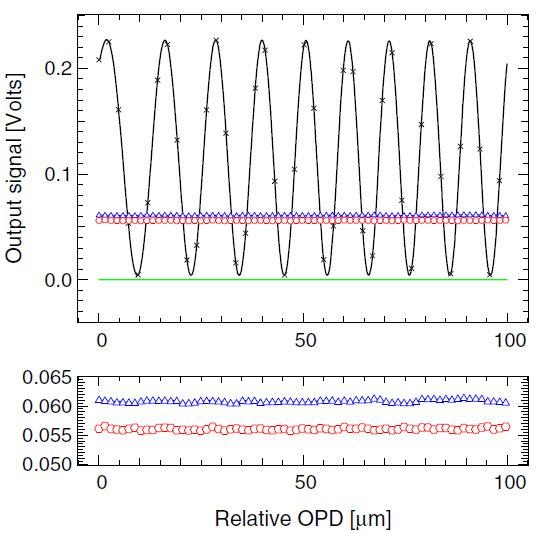
Top: interferometric scan obtained with the Y-junction at 10.6 μm (black line+crosses); Photometry 1 (red curve with circles); Photometry 2 (blue curve with triangles); Bias signal (green solid line). Bottom: zoom on the photometric channels 1 and 2 in each arm of the Y-junction over the same OPD range as for the interferometric signal.
Current usage metrics show cumulative count of Article Views (full-text article views including HTML views, PDF and ePub downloads, according to the available data) and Abstracts Views on Vision4Press platform.
Data correspond to usage on the plateform after 2015. The current usage metrics is available 48-96 hours after online publication and is updated daily on week days.
Initial download of the metrics may take a while.