Fig. 5
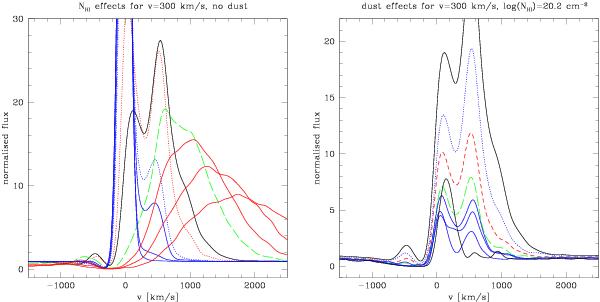
Predicted normalised Lyα line profiles for an expanding shell with vexp = 300 km s-1, b = 40 km s-1, and with varying Hi column densities (left panel), and varying dust content (right panel). All line profiles are normalised around ± 5900 km s-1. Left: shown are models with log NHI = 19.3 (blue dotted), 19.9 (red dotted), 20.2 (black), 20.8 (green dashed) cm-2 comparable to those in Fig. 16 of Verhamme et al. (2006), plus models with lower column densities (log NHI = 16., 18., 19. cm-2, solid blue), and with higher lower column densities (log NHI = 21.1, 21.4, 21.7 cm-2, solid red). Right: shown are models with τa = 0. (black, top), 0.1 (blue dotted), 0.5 (red dashed), 1. (green dashed) comparable to those in Fig. 16 of Verhamme et al. (2006), plus models with higher optical depths (τa = 1.5, 2., 3. (solid blue), and 4. (solid black)).
Current usage metrics show cumulative count of Article Views (full-text article views including HTML views, PDF and ePub downloads, according to the available data) and Abstracts Views on Vision4Press platform.
Data correspond to usage on the plateform after 2015. The current usage metrics is available 48-96 hours after online publication and is updated daily on week days.
Initial download of the metrics may take a while.