Fig. 3
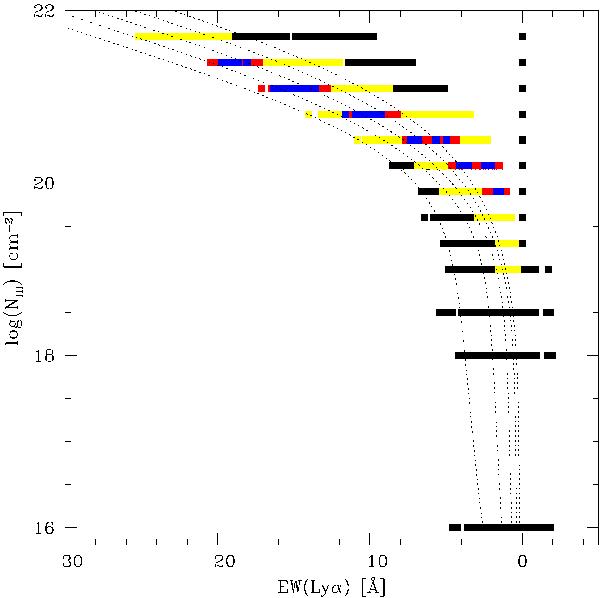
Predicted EWLyα in absorption from our model grid as a function of NHI (black points) for a flat (constant) input spectrum, simulating a pure UV continuum. Colour codes for the symbols as in Fig. 1. Predictions at EWLyα = 0 correspond to dust free models. The dotted lines show EWLyα obtained from pure Voigt profiles for b = 10, 20, 40, 80, and 160 km s-1 (from right to left).
Current usage metrics show cumulative count of Article Views (full-text article views including HTML views, PDF and ePub downloads, according to the available data) and Abstracts Views on Vision4Press platform.
Data correspond to usage on the plateform after 2015. The current usage metrics is available 48-96 hours after online publication and is updated daily on week days.
Initial download of the metrics may take a while.