Fig. A.3
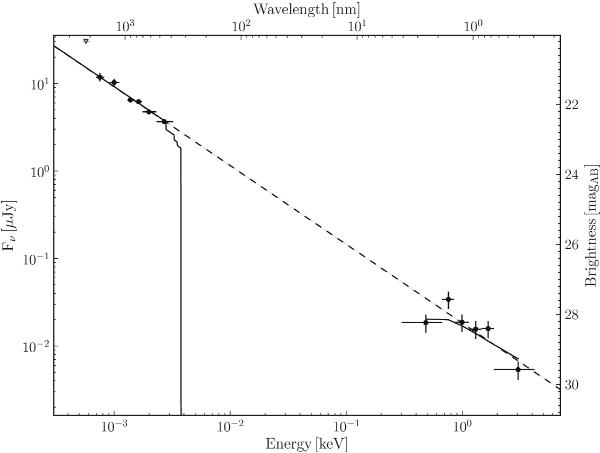
X-ray to optical spectral energy distribution of the afterglow of GRB 090426 at t = 8 ks after the burst, calculated based on the fitted light curve (Fig. 4). The fit uses  × 1022 cm-2 and corresponds to a negligible host extinction, a gas column density of
  × 1022 cm-2, and a spectral slope of βOX = 0.90 ± 0.03 (χ2 = 10.85 with 7 d.o.f., χν = 1.55).
Current usage metrics show cumulative count of Article Views (full-text article views including HTML views, PDF and ePub downloads, according to the available data) and Abstracts Views on Vision4Press platform.
Data correspond to usage on the plateform after 2015. The current usage metrics is available 48-96 hours after online publication and is updated daily on week days.
Initial download of the metrics may take a while.