Fig. 8
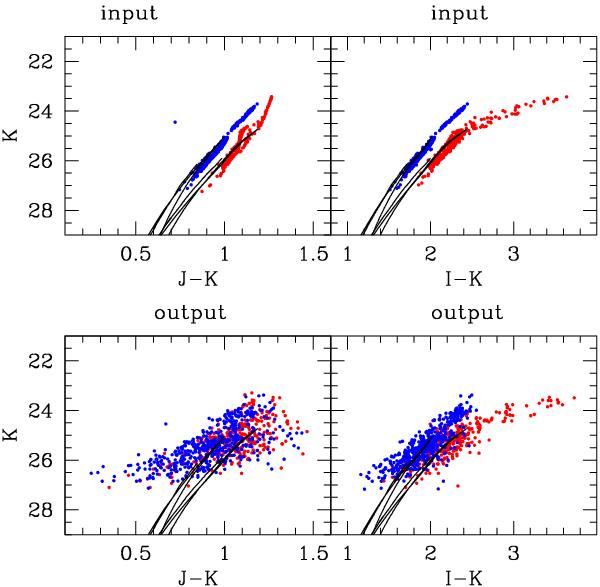
Here we show the stellar population that is the input to the simulated images (upper panels) and the output photometry measured (lower panels), in (K,J − K) and (K,I − K), assuming a surface brightness, μV = 19 mag/arcsec2, for the stellar population defined in Fig. 4. The two distinct star formation episodes are colour coded, so that the impact of the different filter choices can be better judged.
Current usage metrics show cumulative count of Article Views (full-text article views including HTML views, PDF and ePub downloads, according to the available data) and Abstracts Views on Vision4Press platform.
Data correspond to usage on the plateform after 2015. The current usage metrics is available 48-96 hours after online publication and is updated daily on week days.
Initial download of the metrics may take a while.