Fig. 4
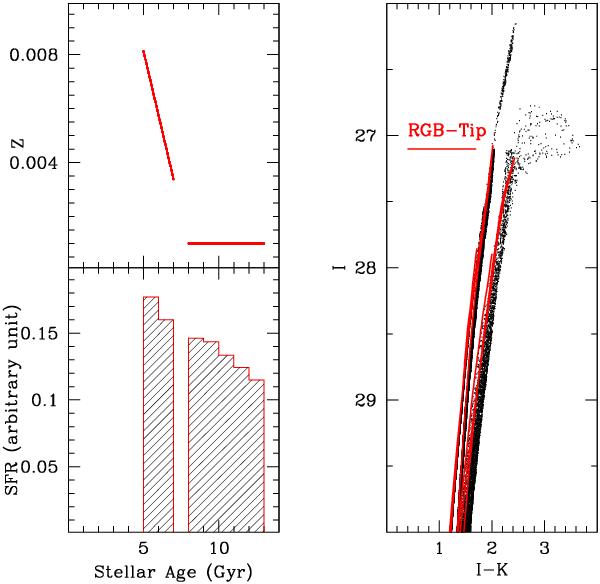
Input properties of the stellar population for a predominantly old galaxy. On the left, the star formation rate with time is shown in the lower panel and the corresponding chemical evolution is shown in the upper panel. The resulting CMD of the galaxy, created using IAC-star (Aparicio & Gallart 2004), is shown on the right. To highlight the mean properties of the stellar populations, we have added isochrones (red solid lines) to the CMD for an old stellar population (10 Gyr) with Z = 0.001 and an intermediate one (6 Gyr) with Z = 0.004, from Pietrinferni et al. (2004).
Current usage metrics show cumulative count of Article Views (full-text article views including HTML views, PDF and ePub downloads, according to the available data) and Abstracts Views on Vision4Press platform.
Data correspond to usage on the plateform after 2015. The current usage metrics is available 48-96 hours after online publication and is updated daily on week days.
Initial download of the metrics may take a while.