Fig. 7
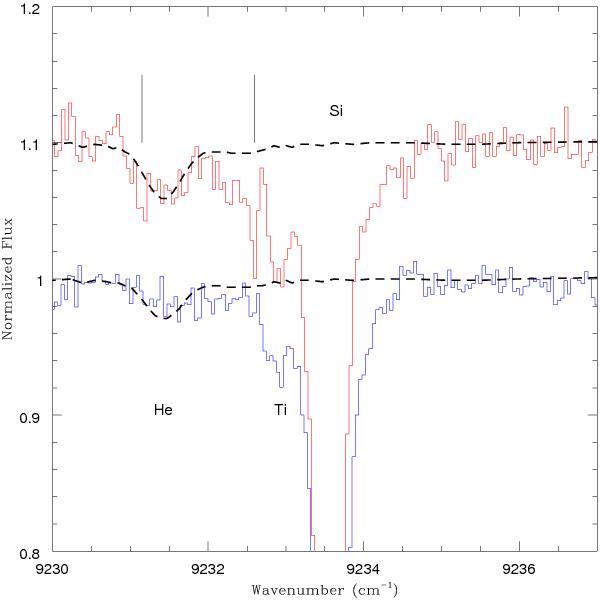
Observed spectra vs. He models. The He lines in the models have been shifted by 17 km s-1. The model superimposed on the data for star 46 422 (lower spectrum) has Y = 022. We find that this model is the most He-rich still compatible with the observed spectrum (see text). For star 48 889 (upper spectrum), the model has Y = 0.39. This is the minimum He abundance compatible with the observed spectrum, but a higher value of Y cannot be excluded. Observed spectra are continuous lines, where the models are dashed (black) lines. Other spectral lines are marked. The position of the telluric lines in the spectrum of star 48 889 is marked as vertical bars above the spectra.
Current usage metrics show cumulative count of Article Views (full-text article views including HTML views, PDF and ePub downloads, according to the available data) and Abstracts Views on Vision4Press platform.
Data correspond to usage on the plateform after 2015. The current usage metrics is available 48-96 hours after online publication and is updated daily on week days.
Initial download of the metrics may take a while.