Free Access
Fig. 1
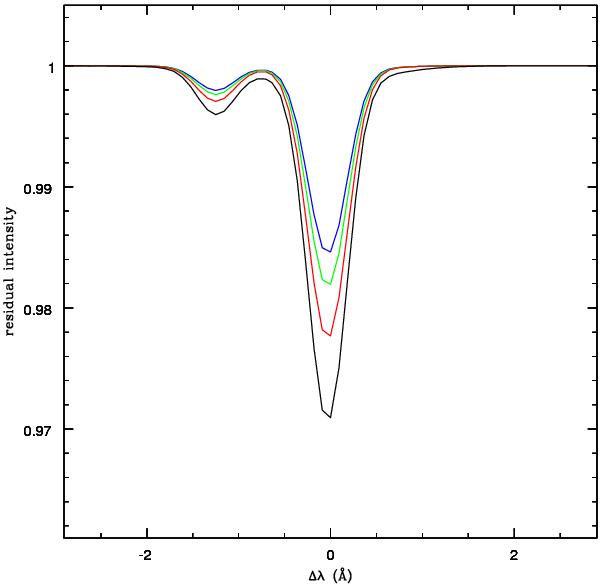
Simulations of the He 10 830 lines for our stars, using the chromospheric model of Mauas et al. (2006). The line equivalent width changes dramatically with the He abundance: the black line corresponds to Y = 0.3, and the other lines correspond to a progressive decrease in steps of 0.03 in the He abundance.
Current usage metrics show cumulative count of Article Views (full-text article views including HTML views, PDF and ePub downloads, according to the available data) and Abstracts Views on Vision4Press platform.
Data correspond to usage on the plateform after 2015. The current usage metrics is available 48-96 hours after online publication and is updated daily on week days.
Initial download of the metrics may take a while.