Fig. 5
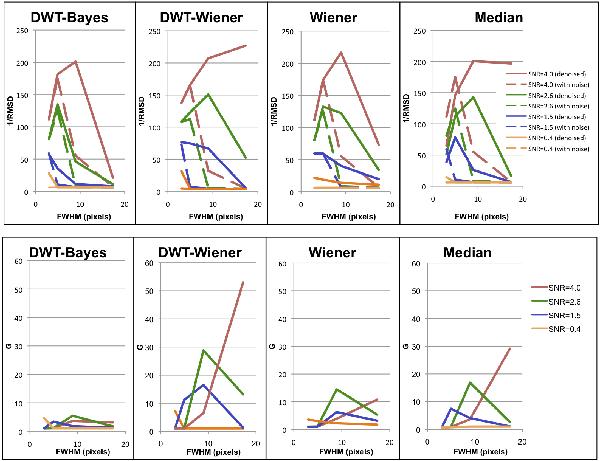
Top panels: accuracy, 1/RMSD, of the shape measurement using the four denoising methods (solid curves). The dashed curves show for comparison the results obtained with the data before denoising. In each panel, the color code indicates different noise levels. Bottom panels: gain ratio, G, for the four denoising methods. The curves are the ratio of the solid to dashed curves shown in the top panels.
Current usage metrics show cumulative count of Article Views (full-text article views including HTML views, PDF and ePub downloads, according to the available data) and Abstracts Views on Vision4Press platform.
Data correspond to usage on the plateform after 2015. The current usage metrics is available 48-96 hours after online publication and is updated daily on week days.
Initial download of the metrics may take a while.