Fig. 4
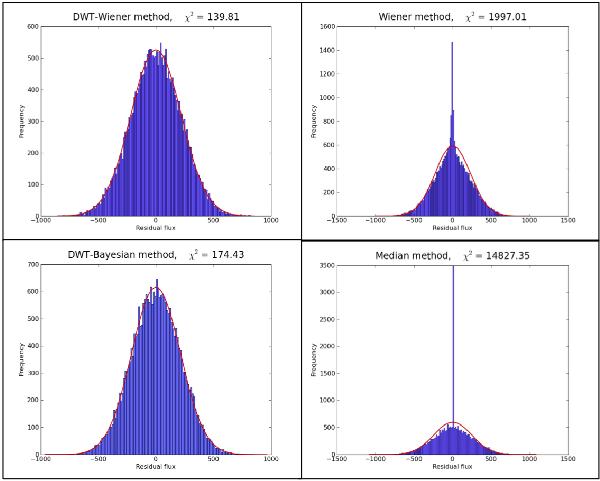
Effect of the four denoising methods on the noise properties of the original data. Each panel shows the normalized histograms of residual images, i.e., the difference between the original noisy data and the denoised data. The red line shows the best-fit Gaussian. In each case, the χ2 of the fit is indicated. The mean SNR in the image selected to compute the histogram is SNR = 0.38.
Current usage metrics show cumulative count of Article Views (full-text article views including HTML views, PDF and ePub downloads, according to the available data) and Abstracts Views on Vision4Press platform.
Data correspond to usage on the plateform after 2015. The current usage metrics is available 48-96 hours after online publication and is updated daily on week days.
Initial download of the metrics may take a while.