Fig. 9
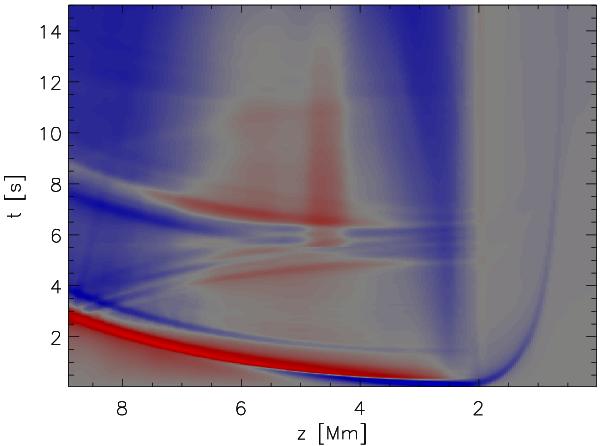
Vertical velocity uz in 2D test model, red is downflow and blue upflow with a color scale set to ± 50 km s-1, as a function of time and height at the position x = 5 Mm in our 2D test model (see text). The disturbance clearly visible is a fast mode wave that originates due to a slight imbalance in the Lorentz force in the transition region in the initial state. The wave propagates fairly cleanly through the upper boundary, with a reflection of some 5%.
Current usage metrics show cumulative count of Article Views (full-text article views including HTML views, PDF and ePub downloads, according to the available data) and Abstracts Views on Vision4Press platform.
Data correspond to usage on the plateform after 2015. The current usage metrics is available 48-96 hours after online publication and is updated daily on week days.
Initial download of the metrics may take a while.