Fig. 8
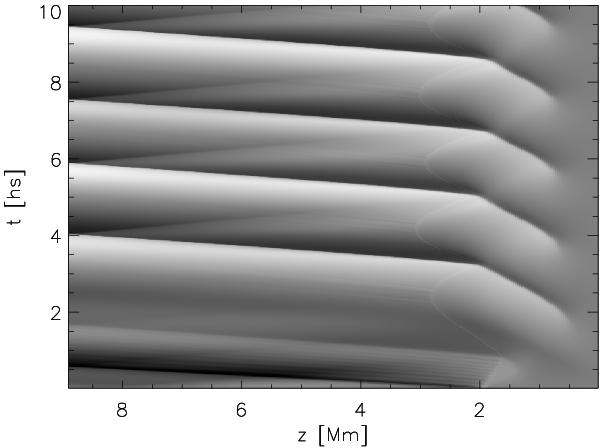
Vertical velocity uz in 1D test model. The color scale is set to span ± 30 km s-1 with black representing upflow and white downflow. The chromosphere adjusts its structure, which initially is not quite in hydrostatic equilibrium, by emitting acoustic waves at the cut-off frequency. These waves are initially strong enough to form shocks, as here during the first 1000 s of the simulation.
Current usage metrics show cumulative count of Article Views (full-text article views including HTML views, PDF and ePub downloads, according to the available data) and Abstracts Views on Vision4Press platform.
Data correspond to usage on the plateform after 2015. The current usage metrics is available 48-96 hours after online publication and is updated daily on week days.
Initial download of the metrics may take a while.