Fig. 6
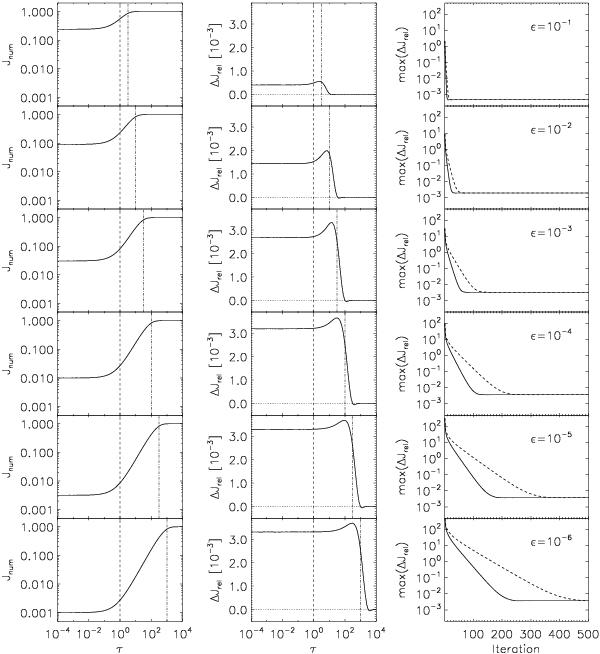
Numerical solution for the mean intensity Jnum as a function of optical depth τ (left column), relative deviation ΔJrel from the analytical solution as a function of optical depth τ (center column), and maximum relative deviation max(ΔJrel) as a function of iteration count (right column). The photon destruction probability ϵ ranges from 10-1 (top row) to 10-6 (bottom row). The dashed and dot-dashed lines in the left column and center column mark the optical surface at τ = 1 and the thermalization depth τtherm. The dotted line in the center column indicates zero deviation. Dashed lines in the right column show the convergence speed for Gauss-Seidel corrections applied only during upsweeps, solid lines show the convergence speed for corrections applied during both upsweeps and downsweeps.
Current usage metrics show cumulative count of Article Views (full-text article views including HTML views, PDF and ePub downloads, according to the available data) and Abstracts Views on Vision4Press platform.
Data correspond to usage on the plateform after 2015. The current usage metrics is available 48-96 hours after online publication and is updated daily on week days.
Initial download of the metrics may take a while.