Fig. 11
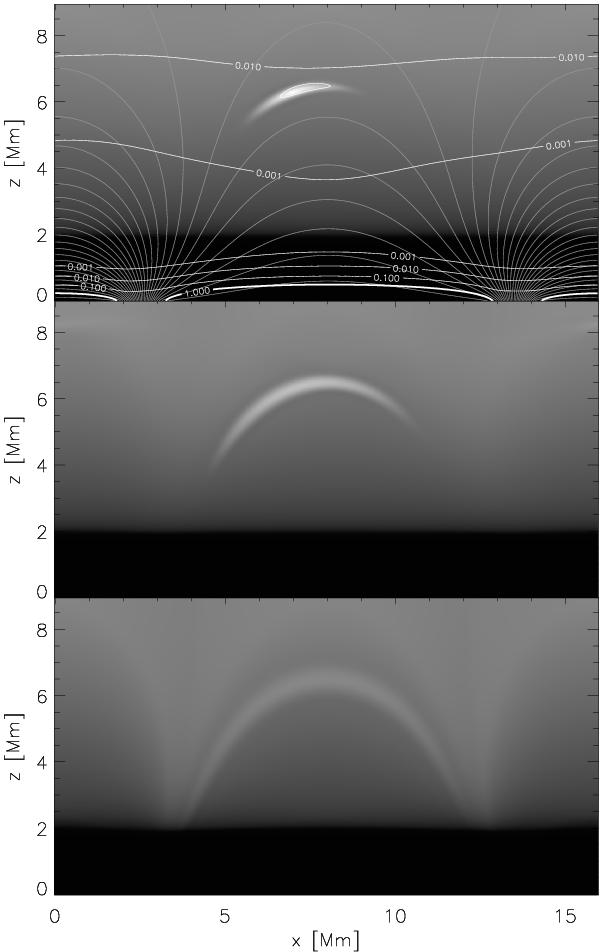
Time evolution of 2D model which is heated for 1 s at position x = 7 Mm, z = 6.3 Mm with 50 J/m3 over a region spanning 100 × 100 km2. The panels show the temperature at t = 0.6 s (top) when the maximum temperature is 2.25 MK, at t = 1.8 s (middle) when the maximum temperature is 1.63 MK, and at t = 10 s (bottom) where the maximum temperature is 1.16 MK. The temperature increases rapidly in the heated region, reaching 2.4 MK at 1 s, and plasma is heated by thermal conduction along the field as the plasma cools. Note that the upper boundary is set to have zero temperature gradient, so the entire atmosphere cools as well. Magnetic field lines are indicated with thin grey contours and contours of constant β are shown with white numbered lines.
Current usage metrics show cumulative count of Article Views (full-text article views including HTML views, PDF and ePub downloads, according to the available data) and Abstracts Views on Vision4Press platform.
Data correspond to usage on the plateform after 2015. The current usage metrics is available 48-96 hours after online publication and is updated daily on week days.
Initial download of the metrics may take a while.