Fig. 10
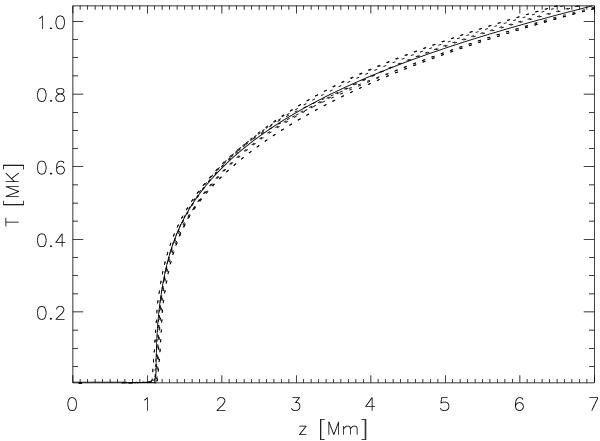
Comparison of high resolution 1D model (solid line Δz ≳ 80 m) with Bifrost test run with Δz = 35 km (dashed lines). The models are set up to have a temperature maximum of 1.1 Mm at the upper boundary such that conduction dominates the energetics of the atmosphere in the corona and transition region. The results from the Bifrost run are taken from the same model as used in Fig. 8, but at much later times (t > 8 000 s) when acoustic perturbations are largely damped and the amplitude of transition region motion is less than 300 km.
Current usage metrics show cumulative count of Article Views (full-text article views including HTML views, PDF and ePub downloads, according to the available data) and Abstracts Views on Vision4Press platform.
Data correspond to usage on the plateform after 2015. The current usage metrics is available 48-96 hours after online publication and is updated daily on week days.
Initial download of the metrics may take a while.