Fig. 8
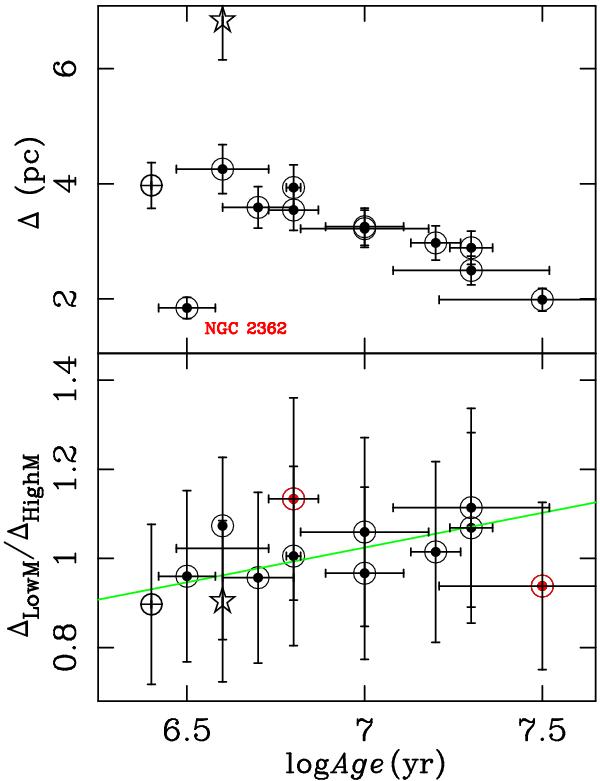
Characteristic clustering scales, Δ (see text), plotted versus cluster Age. The upper panel shows Δ for PMS members of mass above the approximate completeness limit defined in Sect. 3.1.2. The relatively more concentrated NGC 2362 is marked in red. In the lower panel, the ratio between the Δ values of the lower mass (1–2 M⊙) and higher mass (2–3.5 M⊙) PMS members is shown. Representative points for NGC 2264 and NGC 1893 are shown for comparison (crossed circle and star, respectively. See Sect. 2.3). Vertical error bars are calculated with the assumption that the member numbers have an absolute error equal to their square root. A linear squares fit with exclusion of NGC 3293 and Trumpler 18 (red symbols), and a correlation coefficient of 0.7, is plotted as a straight green line.
Current usage metrics show cumulative count of Article Views (full-text article views including HTML views, PDF and ePub downloads, according to the available data) and Abstracts Views on Vision4Press platform.
Data correspond to usage on the plateform after 2015. The current usage metrics is available 48-96 hours after online publication and is updated daily on week days.
Initial download of the metrics may take a while.