Fig. 7
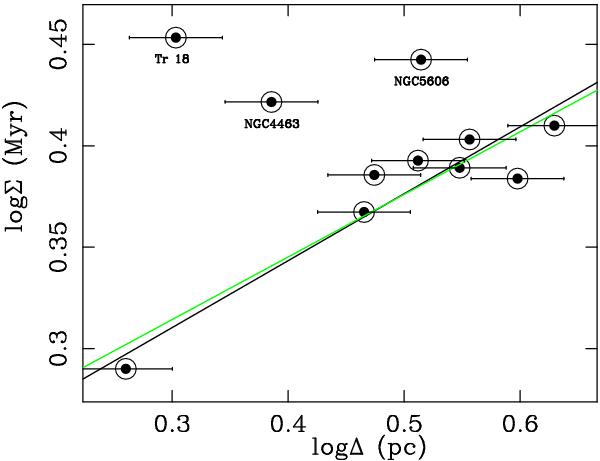
Relation between the rms deviation of the men PMS age (Σ) and the size of the clusters, given by the characteristic clustering scale (Δ. See text) for PMS members of masses above the approximate completeness limit (see Sect. 3.1.2). Horizontal error bars are calculated with the assumption of a typical error in the distance modulus of 0.2. A bootstrapping estimate of the uncertainty in Σ gives values similar to the size of the representative points. The straight line reproduces the slope (0.33) of the scaling relation between age spread and size proposed by Efremov & Elmegreen (1998) for star-forming regions in a wide range of sizes. The green line shows a linear least squares fit, excluding the clusters marked with their names. A slope of 0.31 and a correlation coefficient of 0.8 are obtained.
Current usage metrics show cumulative count of Article Views (full-text article views including HTML views, PDF and ePub downloads, according to the available data) and Abstracts Views on Vision4Press platform.
Data correspond to usage on the plateform after 2015. The current usage metrics is available 48-96 hours after online publication and is updated daily on week days.
Initial download of the metrics may take a while.