Fig. 3
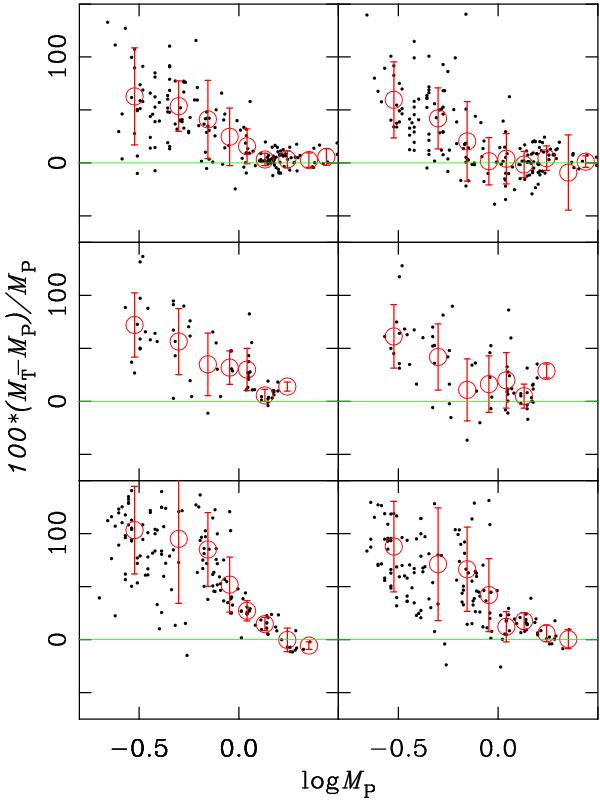
Percentage difference between the masses for PMS cluster members in NGC 2264, calculated by our procedure (T-values; see text) and those by D07, F06, and R02 (P-values), from upper to lower panels, respectively. The quantity 100 × (MT − MP)/MP is plotted versus MP, in the three published cases. The panels to the left show the masses calculated with respect to S00 isochrones. The panels to the right show masses calculated with respect to Y01 isochrones. Red circles and error bars show averages and rms deviations in the corresponding mass bins. The figure is to be compared to Figs. 4 and 5 in H04.
Current usage metrics show cumulative count of Article Views (full-text article views including HTML views, PDF and ePub downloads, according to the available data) and Abstracts Views on Vision4Press platform.
Data correspond to usage on the plateform after 2015. The current usage metrics is available 48-96 hours after online publication and is updated daily on week days.
Initial download of the metrics may take a while.