Fig. 2
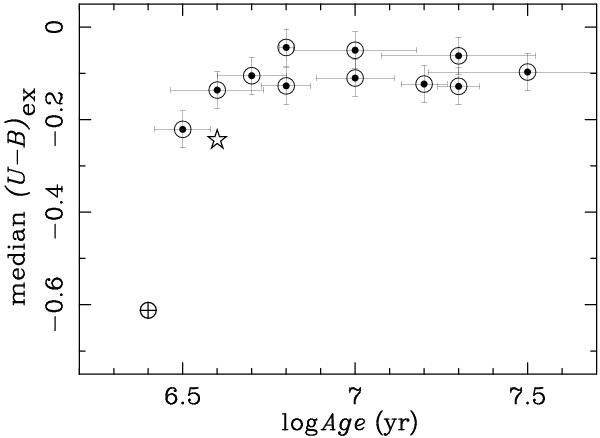
Median (U − B) excess for the stars with negative calculated value (see text), plotted versus cluster age, obtained from quantitative comparison to Padova isochrones. The plotted error bars reproduce the standard error of the mean in each case. Values for NGC 2264 (crossed circle) and NGC 1893 (star) are also plotted for comparison.
Current usage metrics show cumulative count of Article Views (full-text article views including HTML views, PDF and ePub downloads, according to the available data) and Abstracts Views on Vision4Press platform.
Data correspond to usage on the plateform after 2015. The current usage metrics is available 48-96 hours after online publication and is updated daily on week days.
Initial download of the metrics may take a while.