Fig. 5
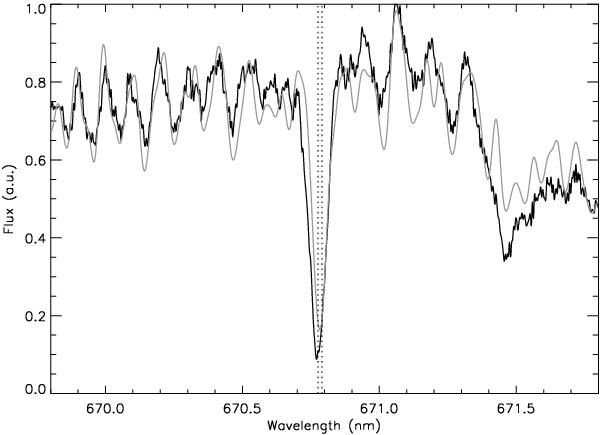
Observed spectrum of R Nor around the Li line doublet (black graph), together with a synthetic spectrum (grey graph). The synthetic spectrum is based on a COMARCS model atmosphere with Teff = 3200 K, log g = 0.0, solar metallicity, and solar C/O ratio. A Li abundance of log ϵ(Li) = + 4.6 was assumed in the spectral synthesis. The dotted vertical lines indicate the laboratory wavelengths of the Li line doublet. All other features in the plotted range are due to TiO.
Current usage metrics show cumulative count of Article Views (full-text article views including HTML views, PDF and ePub downloads, according to the available data) and Abstracts Views on Vision4Press platform.
Data correspond to usage on the plateform after 2015. The current usage metrics is available 48-96 hours after online publication and is updated daily on week days.
Initial download of the metrics may take a while.