Fig. 4
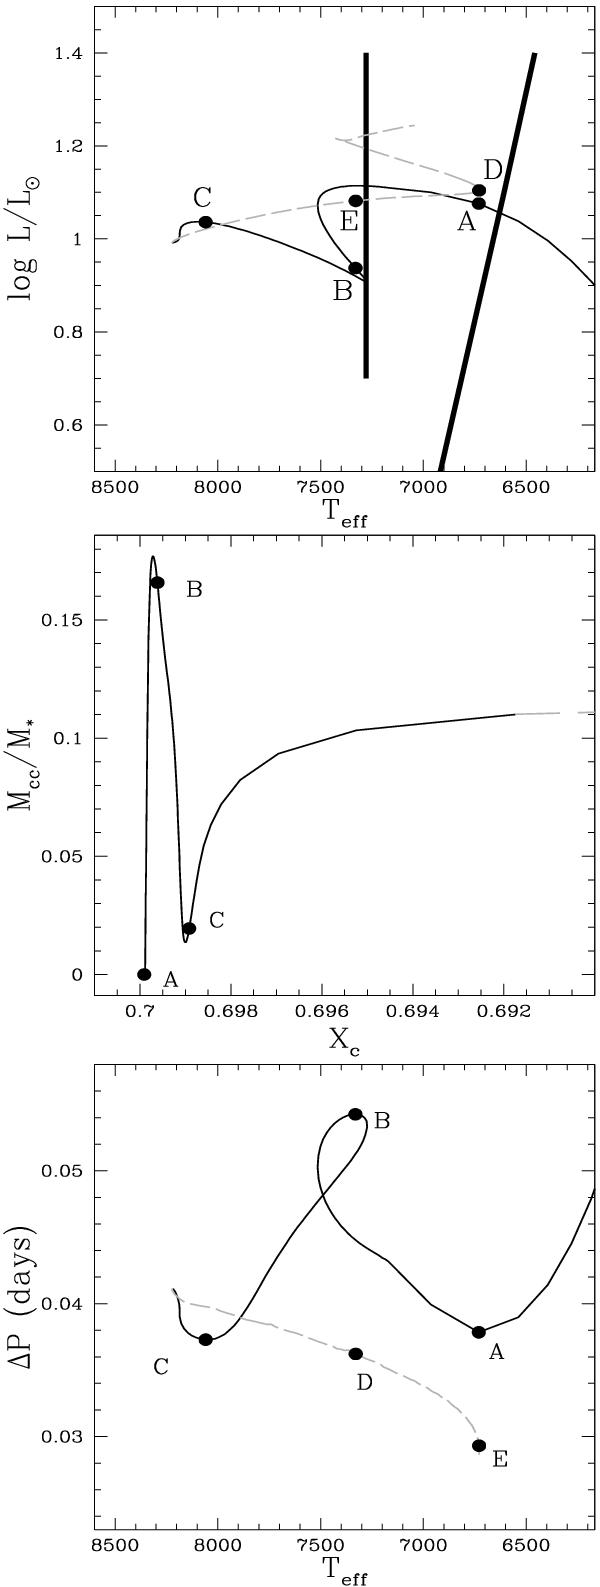
Top panel: evolution of a 1.8 M⊙ star in the HRD (PMS phase in full black and MS phase in dashed grey) crossing the γ Dor IS (thick black lines – HS02). Middle panel: variation in its CC mass from the PMS phase to the early MS phase (Xc = 0.69). Bottom panel: Evolution of the ℓ = 1 modes period spacing as a function of the effective temperature of the star from the PMS to the end of MS (point E).
Current usage metrics show cumulative count of Article Views (full-text article views including HTML views, PDF and ePub downloads, according to the available data) and Abstracts Views on Vision4Press platform.
Data correspond to usage on the plateform after 2015. The current usage metrics is available 48-96 hours after online publication and is updated daily on week days.
Initial download of the metrics may take a while.