Fig. 2
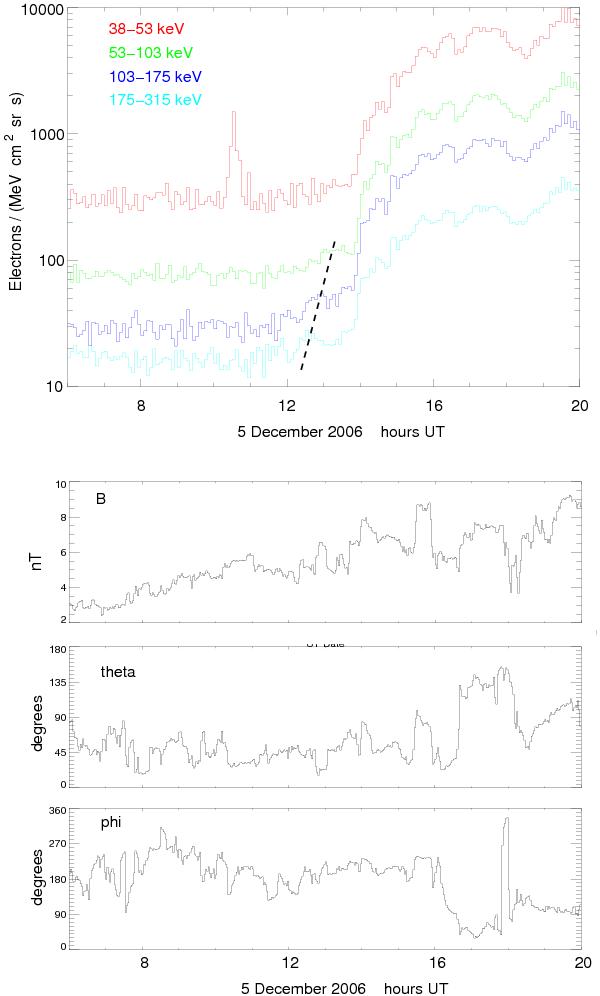
Upper panel: the intensity-time history of the precursor event and the main event at ACE, seen in the four deflected electron channels on EPAM. The energies of the channels are 38–53 keV (red), 53–103 keV (green), 103–175 keV (blue) and 175–315 keV (cyan) and they are plotted as 5 min averages and spin averages. The dashed line indicates the possible velocity dispersion seen before the main onset at around 13:50 UT. Lower panels: the magnetic field at ACE, plotted as the magnitude (B), colatitude (theta) and azimuth (phi).
Current usage metrics show cumulative count of Article Views (full-text article views including HTML views, PDF and ePub downloads, according to the available data) and Abstracts Views on Vision4Press platform.
Data correspond to usage on the plateform after 2015. The current usage metrics is available 48-96 hours after online publication and is updated daily on week days.
Initial download of the metrics may take a while.